


Description
The TCS3200 and TCS3210 are advanced programmable color light-to-frequency converters, designed to provide precise color sensing and light intensity measurement. These devices incorporate configurable silicon photodiodes and a current-to-frequency converter into a single monolithic CMOS integrated circuit, resulting in a versatile solution for various applications.
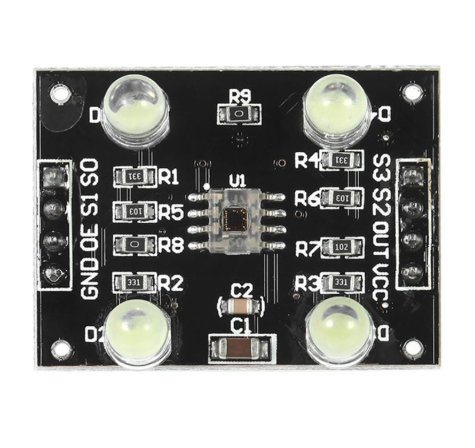
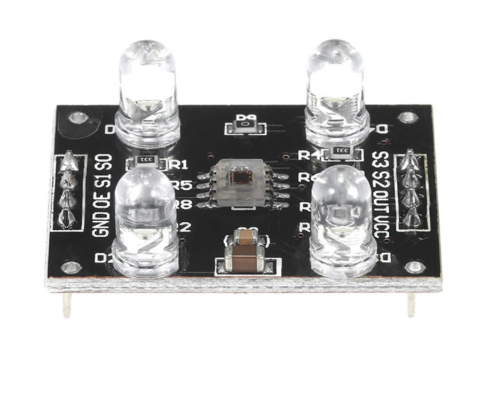
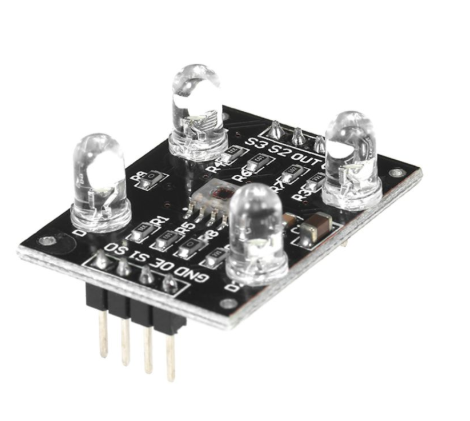
TCS230 Color Sensor Module
At the heart of the module is an inexpensive RGB sensor chip from Texas Advanced Optoelectronic Solutions – TCS230. The TCS230 Color Sensor is a complete color detector that can detect and measure an almost infinite range of visible colors.

The sensor itself can be seen at the center of the module, surrounded by the four white LEDs. The LEDs light up when the module is powered up and are used to illuminate the object being sensed. Thanks to these LEDs, the sensor can also work in complete darkness to determine the color or brightness of the object.
The TCS230 operates on a supply voltage of 2.7 to 5.5 volts and provides TTL logic-level outputs.
TCS230 Operation
The TCS230 detects color with the help of an 8 x 8 array of photodiodes, of which sixteen photodiodes have red filters, 16 photodiodes have green filters, 16 photodiodes have blue filters, and remaining 16 photodiodes are clear with no filters.
If you look closely at the sensor, you can actually see these filters.

Each 16 photodiodes are connected in parallel, so using two control pins S2 and S3 you can choose which of them to read. So for example, if you want to detect only red color, you can select 16 red-filtered photodiodes by setting the two pins to LOW according to the table.
Similarly, you can choose different types of photodiodes by different combinations of S2 and S3.
| S2 | S3 | Photodiode type |
| LOW | LOW | Red |
| LOW | HIGH | Blue |
| HIGH | LOW | Clear (No filter) |
| HIGH | HIGH | Green |
An internal current-to-frequency converter converts readings from photodiodes into a square wave whose frequency is proportional to the intensity of the chosen color. The range of the typical output frequency is 2HZ~500KHZ.
The sensor has two more control pins, S0 and S1, which are used for scaling the output frequency. The frequency can be scaled to three different preset values of 2%, 20% or 100%. This frequency-scaling function allows the sensor to be used with a variety of microcontrollers and other devices.
| S0 | S1 | Output frequency scaling |
| LOW | LOW | Power down |
| LOW | HIGH | 2% |
| HIGH | LOW | 20% |
| HIGH | HIGH | 100% |
You can get different scaling factor by different combinations of S0 and S1. For the Arduino most applications use the 20% scaling.
TCS230 Color Sensor Module Pinout
The following diagram shows the pinout of a common TCS230 module.

GND is a ground pin.
OE is the Output Enable pin. This pin is rarely used and on most modules is permanently enabled. If not already enabled then pull it LOW.
S0 & S1 pins are used to select the frequency scaling.
S2 & S3 pins are used to select the color array.
OUT pin is a TTL level square wave.
VCC pin supplies power to the module. Connect it to the 2.7V to 5.5V power supply.
Wiring TCS230 Color Sensor to Arduino UNO
Hooking up the TCS 230 to an Arduino is very simple. Every pin is used except the Output Enable pin, and the module is powered safely from the 5-volt output of the Arduino.
Below is the hookup for the experiments with the TCS230:

None of the pins used on the Arduino are critical because the module does not require any pin-specific features, so if you want to use different pins you can do so safely. Just be sure to change the pin numbers in the code to reflect any changes to the wiring.
Once your sensor is connected to the Arduino it’s time to write some code!
Calibrating the Sensor
We will actually use two sketches to work with the TCS230 color sensor.
- The first sketch (calibration sketch) will help us to obtain the raw data from the sensor.
- The second sketch (main Arduino sketch) will use the raw data previously received to display RGB values for the color being sensed.
Note that both sketches will use the same hardware hookup.
ollowing is the calibration sketch. This sketch addresses the TCS230 sensor color-by-color and reads the pulse width of the output pin. The output is then displayed on the serial monitor.
Load the sketch to your Arduino and mount the sensor so that it is facing the objects. Start by finding a reference object for white and black color. These reference objects will produce readings at both maximum and minimum values for all three colors.
// Define color sensor pins
#define S0 4
#define S1 5
#define S2 6
#define S3 7
#define sensorOut 8

// Variables for Color Pulse Width Measurements
int redPW = 0;
int greenPW = 0;
int bluePW = 0;

void setup() {
	// Set S0 - S3 as outputs
	pinMode(S0, OUTPUT);
	pinMode(S1, OUTPUT);
	pinMode(S2, OUTPUT);
	pinMode(S3, OUTPUT);

	// Set Pulse Width scaling to 20%
	digitalWrite(S0,HIGH);
	digitalWrite(S1,LOW);

	// Set Sensor output as input
	pinMode(sensorOut, INPUT);

	// Setup Serial Monitor
	Serial.begin(9600);
}

void loop() {
	// Read Red Pulse Width
	redPW = getRedPW();
	// Delay to stabilize sensor
	delay(200);

	// Read Green Pulse Width
	greenPW = getGreenPW();
	// Delay to stabilize sensor
	delay(200);

	// Read Blue Pulse Width
	bluePW = getBluePW();
	// Delay to stabilize sensor
	delay(200);

	// Print output to Serial Monitor
	Serial.print("Red PW = ");
	Serial.print(redPW);
	Serial.print(" - Green PW = ");
	Serial.print(greenPW);
	Serial.print(" - Blue PW = ");
	Serial.println(bluePW);
}


// Function to read Red Pulse Widths
int getRedPW() {
	// Set sensor to read Red only
	digitalWrite(S2,LOW);
	digitalWrite(S3,LOW);
	// Define integer to represent Pulse Width
	int PW;
	// Read the output Pulse Width
	PW = pulseIn(sensorOut, LOW);
	// Return the value
	return PW;
}

// Function to read Green Pulse Widths
int getGreenPW() {
	// Set sensor to read Green only
	digitalWrite(S2,HIGH);
	digitalWrite(S3,HIGH);
	// Define integer to represent Pulse Width
	int PW;
	// Read the output Pulse Width
	PW = pulseIn(sensorOut, LOW);
	// Return the value
	return PW;
}

// Function to read Blue Pulse Widths
int getBluePW() {
	// Set sensor to read Blue only
	digitalWrite(S2,LOW);
	digitalWrite(S3,HIGH);
	// Define integer to represent Pulse Width
	int PW;
	// Read the output Pulse Width
	PW = pulseIn(sensorOut, LOW);
	// Return the value
	return PW;
}
Once you upload the sketch you will get such readings. Record the readings you get at both extremes.

Code Explanation:
The sketch begins with defining the pins used to connect the TCS230. Some variables are also defined to represent the pulse widths of the red, green and blue color array.
In the setup, we define the S0-S3 pins as outputs. These pins will be used to select the frequency scaling and the color we wish to address. The S0 and S1 pins are used to set the frequency scaling to 20%, which is a common value when using this color sensor with an Arduino. Next, The sensors Output pin is defined as an input to the Arduino, this is where we will receive the square wave. Finally, we set up the serial monitor.
getRedPW(), getGreenPW() and getBluePW() to obtain the pulse width. Let’s examine getRedPW() as an example.
The getRedPW() function gets the red pulse width. It starts by setting the S2 and S3 pins to select the red filter. This is the only step where this function differs from its green and blue counterparts.
Next, an integer is defined to store the pulse width. The pulse width is then determined using the Arduino pulseIn() function. This function measures the pulse width, note that we have configured it to measure the width of the LOW part of the pulse. The result is time in milliseconds. This value is then returned and the function terminates.
Back in the loop, we call three functions to read the color pulse widths, adding a delay of 200ms between them to allow the sensor to stabilize. We then print the values on the serial monitor and repeat the loop.